Parametric Equations of Planar Curves 1
Within the
framework of analytic geometry, curved lines are described by equations that
relate the Cartesian coordinates x and y of points on a curve. Such equations
may contain other variables whose values describe the shape, size and actual
location of the curve.
Examples.
The equation (x-1)2 + (y-3)2
- r2 = 0, describes a circle with its center located at the point
(1, 3), and with radius r, whose value needs to be specified.
To get the upper half of this circle using x,y coordinates, assign some value
to R (say 1→R), set window: Xmin=-2, Xmax=4, Ymin=1, Ymax=5. (I
put axes on.)
and enter
\Y1=√(R2-(X-1)2)+3
and GRAPH.
How to get the bottom half? Enter \Y2 = -Y1 +6, and GRAPH.

Not a very complete
circle! Do you know why?
The equation a*x + b = y describes a straight line which intersects the x-axis
at the point (-b/a, 0) and which intersects the y-axis at (0, b), when a≠0.
When a = 0, the equation a*x + b = y is a line parallel to the x-axis
that intersects the y axis at (0, b).
The equation (x/a)2 + (y/b)2
= 1, where a > b > 0, describes an ellipse with center of symmetry at (0,
0), and its long axis (of length 2a) lying along the x-axis and its short axis
(of length 2b) lying along the y-axis.
Parametric equations are a different way of describing curves. We
introduce a new variable, traditionally named t, and describe the x- and
y-coordinates of a point on the curve in terms of t.
Remark.
The use of the variable t comes from
physics, where the position of a point in space often depends on time. But
t can have different meanings in different situations; for example, t can be an
angle.
Here is a parametric representation of the curves described above.
|
circle:
|
x
= r*cos(t) + 1; |
y
= r*sin(t) + 3. |
|
straight
line: |
x
= t; |
y
= a*t + b. |
|
ellipse:
|
x
= a*cos(t); |
y
= b*sin(t). |
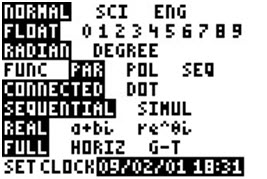
To get into parametric mode, go to MODE and choose PAR (not Func):
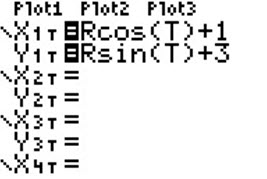
Now when you go to
Y=, you may enter the first two equations:
Now graph and you
will see:
Remarks.
The same curve can be described by many
different parametric equations. For example, the circle described above can be
also described by
|
x
= r*cos(√(t)) + 1; |
y
= r*sin(√(t)) + 3 |
In many cases we can also limit the range
of t. For example, our ellipse is already formed when t varies from
0 to 360 degrees (2π radians).
Tasks.
(a) Use the parametric mode on the TI-83/4 to draw all three curves, circle,
straight line, and ellipse, described above. In parametric mode, you
need to set the window for X and Y, and also for T, the angle, in radians or
degrees. The default for T in radians is Tmin = 0 and Tmax = 2π
≈ 6.2831853. Tstep is the T value increment, and its default
is π/24 ≈ .1308996.
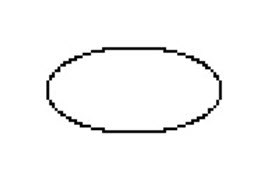
For the ellipse, if you store 2 in A and 1 in B, with window Tmin=0,
Tmax=2π, Tstep=.02, Xmin=-3, Xmax=3, Ymin=-2, Ymax=2, you will see:
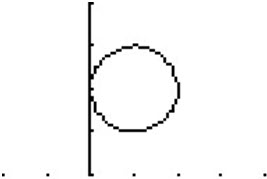
For the straight
line, you may leave 2 in A and 1 in B, but set Tmin=-2π. All
other window settings can stay the same, but you may set Axes on. When
you graph, you will see

(b) Try these curves. Note the window settings.
|
(1)
|
x(t)
= 3 sin(5t) |
(2)
|
x(t)
= 2cos(t) + cos(8t) |
settings:
ZOOM Square, -3<x<3, -3><y<3 |
|
|
y(t)
= 3 cos(3t) |
|
y(t)
= 2sin(t) + sin(8t) |
0≤T≤2π
|
|
(3)
|
The
cycloid |
|
|
|
|
|
x(t)
= a(t - sin(t)) |
|
|
settings:
a = 1, Tmin = 0, Tmax = 30, Tstep = .3, Xmin=0, Xmax=30, Xscl=1, |
|
|
y(t)
= a(1 - cos(t)) |
|
|
Ymin = -10, Ymax = 10, Yscl = 1 |

Calculus Index