Regression line
Given two lists of numbers of length n,
x1 y1
x2 y2
... ...
xn yn
find a first degree polynomial, a*x + b, which gives the best approximation of the y's in terms of the x's. The error of an approximation is computed as
error = (a*x1-y1)2 + (a*x2-y2)2 + ... + (a*xn-yn)2.
A matrix formulation of this question looks as follows:
Consider three matrices, an n by 2 matrix [C], a 2 by 1 unknown matrix [A], and an n by 1 matrix [D],
| [C] = | [A] = | [D] = | ||
| [[1 x1] | [[a1] | [[y1] | ||
| [1 x2] | [a2]] | [y2] | ||
| ... | ... | |||
| [1 xn]] | [yn]] |
(The first column of matrix [C] contains only 1's.)
Find the best approximate solution in A of the equation
[C]*[A] = [D].
It has been proven that the best approximation is given by the formula,
A = ([C]T*[C])-1 * [C]T*[D] ←IMPORTANT FORMULA!
Task.
You may use this formula to find a1 and a2, for two lists with lengths between 8 and 20.
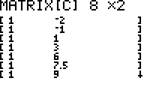
Let's try together the following lists: {-2, -1, 1, 3, 6, 7.5, 9, 10}→X
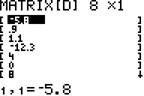
{-5.8, .9, 1.1, -12.3, 4, 0, 8, -15}→Y
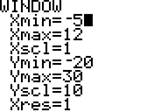
Set the window as follows, and use STAT PLOT to turn on Plot1, giving it lists X and Y:
Enter matrix [C]:and matrix [D]:
Now use the formula from above, press ENTER, and you get:
So the best fitting linear polynomial to our 8 data points is
y = -2.412439282 + .0059556494X . Let's graph it along with the points. Here is a shortcut:
Matr→list([E],L1) (Matrix [E] becomes a list, and the calculator will say "Done".)
Now we can use the elements in L1 as coefficients to our polynomial:
Now graph, and you will see
Let's see if we can get the same equation using the linear regression software on the TI-83.
Got to STAT CALC and pick 4. LinReg (ax+b). Enter the two lists so the screen looks like
LinReg (ax+b) X, Y
and press ENTER. You will see:
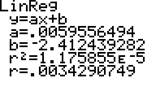
Let's put this equation in Y2. First put your cursor on Y2=. Then go to VARS and pick 5: Statistics. Then go to EQ and pick 1: RegEQ. It is copied into Y2=. Pretty handy!

You may check that when you graph it, you get the same line as we got before!
How good is the fit? Go to LIST and under NAMES you will find a new list called RESID. (This list is formed whenever you run a regression using the calculator's software). Bring RESID to the homescreen and you will see a list of 8 elements:
This list tells how far away from the y-value of the equation the value that you tried to fit is, for each of the eight data points. So -5.8 - Y1(-2) = -3.375649419. Try it from the home screen!
Do you see that this is the first element of LRESID?
How bad is the fit overall, for all 8 points? What is the sum of the squares of the errors? Go to LIST MATH and you will find 5:sum. On the home screen enter sum(LRESID2) and you will see
The error is over 446! Terrible!
Let's fit a quadratic and see if we get a better fit. All we do is put another column in our [C] matrix, and another row in our [D] matrix, and then do our magic formula. We can check what we get with what the calculator software gets with QuadReg, and so on, for cubic and quartic.
I want to show you the quartic that I fit, because it is so beautiful:
And the error is 112.7706277, quite a bit better than 426. Is this cool or what?
Calculus Index