Tossing Icosahedral Dice
Part 1.
Using actual dice
Props: 20 icosahedral dice, a large cup, and a tally sheet
Toss 20 icosahedral (20-sided) dice a number of times, and record the outcomes on this tally sheet:
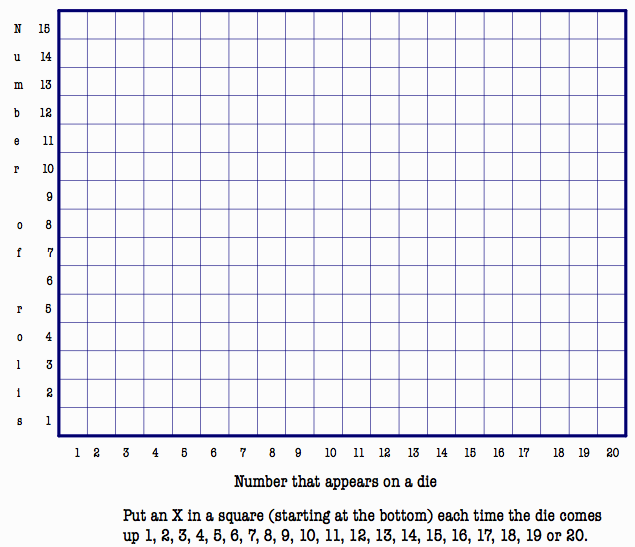
What do you notice from the tally sheet data? Do some numbers come up much more frequently than others?
Since an icosahedral die (an icosahedron) has 20 faces, there are 20 possible outcomes, and in a fair die, each one is equally likely. This means each one has a theoretical probability of .05 or 5%.
How close did you get to a constant .05 for each die? To compute this, sum up the total number of rolls for the dice; call it N. Now for each outcome from one to twenty, use your tally sheet to get the number of times that particular outcome occurred, and divide that number by N. To change it to a percentage, multiply by 100. These 20 numbers are your actual, or empirical, frequencies.)
You may record your results here:
|
out- come |
2 |
3 |
4 |
5 |
6 |
7 |
8 |
9 |
10 |
11 |
12 |
13 |
14 |
15 |
16 |
17 |
18 |
19 |
20 |
|
theor- etical probability |
5 % |
5 % |
5 % |
5 % |
5 % |
5 % |
5 % |
5 % |
5 % |
5 % |
5 % |
5 % |
5 % |
5 % |
5 % |
5 % |
5 % |
5 % |
5 % |
|
actual (empirical) frequency |
|
|
|
|
|
|
|
|
|
|
|
|
|
|
|
|
|
|
|
Do you think that, if you tossed your dice long enough, your actual frequencies would get closer and closer to 5%? We will try this in Part 2 using simulated icosahedral dice!