Mode, mean, median, and quartiles
You
do not need to think about probability to learn about the concepts in this
unit; you only need to think of making sense out of a list of numerical
data. hen you think about
probabilities, you often consider infinite sets of data, such as all whole
numbers or all real numbers, which we avoid in this unit.
Each
of the numbers mode, mean, median, and quartile answers a specific question.
Which value occurs most often?
If
there is one such value, it is the MODE. If there are many, you need to hedge,
or list all of them.
What is the average of all the numbers?
For
every finite list there is such a number; it is the MEAN. For infinite sets of
data the mean may not exist.
You want to order the data by size and
divide them into two groups of equal, or almost equal, size. The question is,
where do you make a cut?
It is
answered by the MEDIAN.
When
you want to put data into four bins, you also need QUARTILES.
Task
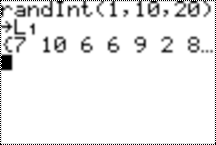
Choose
two numbers, for example, 10 and 20. Make a random list of length 20 of numbers
from 1 to 10 and store them in list L1. Here is an example:
You
may sort it and look at the sorted list L1
on the home screen:
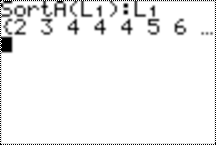
And
you may scroll through to see all the values,
2 3 4
4 4 5 6 6 6 7 7 7 8 8 9 9 10 10 10 10
Find
the values of mode, mean, and median of your list by hand.
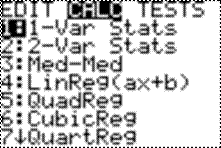
Move
to STAT CALC and choose 1:
After you press enter you will see
1-Var Stats
And you enter L1:
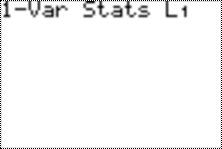
and press ENTER. You will see
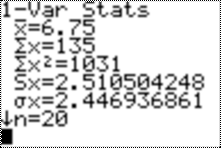
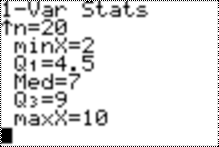
You can then see that
|
|
mean |
|
minX=2 |
|
|
Q1=4.5 |
first quartile |
|
Med=7 |
median |
|
Q3=9 |
third quartile |
|
maxX=10 |
|
In
the example here, the mode is 10, but it is not a part of STAT CALC.
(Other
statistics are also computed by STAT CALC: sum of squares of the numbers, the
sample standard deviation and the population standard deviation. We will talk about them in another lesson.)
Lesson Index