Part 3. A
theoretical interpretation of the activity of tossing M&Ms
First lets interpret all the results that we have gotten thus far. We observed that if we increase the sizes of samples, then most of the time frequency distributions of different samples are similar to each other. This happens very often. And when it happens, we may say that there is an underlying probability distribution. Weve seen it in three cases: tossing two six-sided dice, tossing one 20-sided (icosahedral) die, and throwing M&Ms in groups of seven and counting how many have the letter M up.
In the first two cases we figured out the formulas for this underlying probability distribution, called theoretical probability. In computing the probabilities of tossing two 6-sided dice, we counted cases. In the case of the icosahedral die, we said that if the die is symmetric and not weighted in a weird way, we expect all outcomes are equally probable. In both instances, we gave reasons for our thinking (we had hypotheses about the outcomes, and we had actual data, and we could see how they matched).
One thing that we learned is that we need big samples to get distributions from samples similar to a theoretical distribution described by a mathematical formula. But we don't say that our experimental outcomes for large samples should be similar to the theoretical distribution. We just compare them in order to see how well they match.
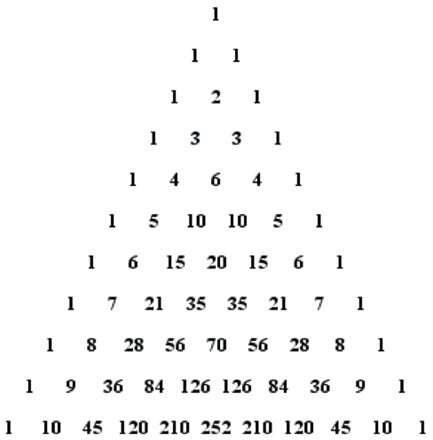
Here we will show you the theoretical probability that is used to explain the frequencies that you observed working with the M&Ms. It is Pascals triangle.
(Of course the triangle does not end here!)
The rows of the triangle are numbered starting at zero. We look at the 7th row, since we tossed 7 M&Ms. We look at all 27 = 128 possible combinations of M-up or M-down patterns of 7 M&Ms. These eight numbers, 1, 7, 21, 35, 35, 21, 7, and 1, give us the number of combinations in which, out of 7 M&Ms, 0, 1, 2, 3, 4, 5, 6, and 7 are M-up. The sum of these numbers is, of course, 128 = 27. So the theoretical probability distributions based on counting cases is 1/27, 7/27, 21/27, , 1/27, as shown in the table below.
|
0 Ms up |
1 M up |
2 Ms up |
3 Ms up |
4 Ms up |
5 Ms up |
6 Ms up |
7 Ms up |
|
1/128 |
7/128 |
21/128 |
35/128 |
35/128 |
21/128 |
7/128 |
1/128 |
|
~.78% |
~5.47% |
~16.4% |
~27.3% |
~27.3% |
~16.4% |
~5.47% |
~.78% |
My data from the simulation in the previous unit, in which the M&Ms were tossed 1000 times:
|
~.6% |
~6.9% |
~15.6% |
~28% |
~24.7% |
~18.8% |
~4.3% |
~1.1% |
What data did you get?
Does Pascals triangle really fit to the data? You will see that most of the time when the sample is quite big, the fit is pretty good.
Can we think why this is the case?
With the 20-sided die, we reasoned by symmetry (the theoretical probability of each outcome is 5%). With tossing two dice, we reasoned by counting cases. Here again we count cases and conclude that the probability of getting 7 Ms up is 1/128, 6 Ms up is 7/128, .
Would you like to see the reasoning?
Look at row 1 in Pascals triangle; it contains two ones: 1 1
Applying it to our M&Ms activity, when one M&M is tossed, there are two possible outcomes, M-up or M-down, and because an M&M is symmetric (the only difference between its two sides is the letter M), both outcomes are equally likely. Thus the probability that it lands with M up is 1/2, and the first row of Pascals triangle shows it.
Look at row 2; it contains 3 numbers: 1 2 1
When we toss two M&Ms, the outcome can be
0 Ms up (there is one case: both down)
1 M up (there are two cases: first up and second down, or first down and second up)
2 Ms up (there is one case: both up)
Again because M&Ms are symmetric, all four cases are equally likely.
So the probabilities of 0, 1 and 2 Ms-up are 1/4 , 1/2 , and 1/4. Again the third row of Pascals triangle shows it.
When we toss three M&Ms, each of the three can land with M up or down, so there are 2 cases for each M&M, and thus 2*2*2=8 outcomes total. Lets list all of them.
M&Ms:
1st 2nd 3rd
up up up
up up down
up down up
up down down
down up up
down up down
down down up
down down down
Now we count the number of outcomes in which M-up occurs 0, 1, 2, or 3 times.
zero up 1 = 1
one up 3 = 2 + 1
two up 3 = 1 + 2
three up 1 = 1
Look at Pascals triangle for row three: 1 3 3 1. Again it predicts these outcomes.
For four M&Ms, we just need to double each row in our previous list of cases by listing 2 cases (one up and one down) for the fourth M&M.
1st 2nd 3rd 4th
up up up up
up up up down
up up down up
up up down down
up down up up
up down up down
up down down up
up down down up
down up up up
down up up down
down up down up
down up down down
down down up up
down down up down
down down down up
down down down down
Now we count:
0 up 1 = 1
1 up 4 = 3 + 1
2 up 6 = 3 + 3
3 up 4 = 1 + 3
4 up 1 = 1
You may check yourself (but it would take time) that for five M&Ms we have:
0 up 1 = 1
1 up 5 = 4 + 1
2 up 10 = 6 + 4
3 up 10 = 4 + 6
4 up 5 = 1 + 4
5 up 1 = 1
When we derive a probability distribution using Pascals triangle, we dont use any experimental data. And we dont need to know the probability distribution in order to run experiments and compute a frequency distribution from a sample.
One reason that statistics is useful is that many questions can be answered in two different ways: By running experiments and computing frequencies from a sample, or by deriving mathematical formulas describing probability distributions.
Pascals triangle has many other uses and we will learn more about them.
Return