Part 2.
Simulating the activity in Part 1 with large samples
We will need a program for our TI-83/84 calculators that simulates a large number of throws of 7 M&M. Here is such a program, which we titled MANDMS:
Explanation of the program, line by line:
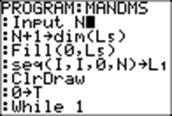
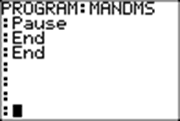
PROGRAM:MANDMS
|
Input
N |
N
is the number of M&Ms that will be tossed on each roll.
Here, N = 7. |
|
N+1→dim(L5) |
For
each roll, there will thus be 8 possible outcomes, varying from 0 (no Ms up) through 7 (all Ms up). List L5 shows how many times each of the
numbers from 0 to 7 occurs in the current sample. L5 (1) shows the number of 0's,, and L5 (8) shows the number of 7s. |
|
Fill(0,L5) |
Every
element of list L5 is set to zero at the beginning,
before there have been any rolls. |
|
seq(I,I,0,N)→L1 |
List
L1 is filled with the integers zero
through 7. |
|
ClrDraw |
The
graphing window is cleared of any drawing. |
|
0→T |
T
is set at zero at the beginning. Variable T holds the current size of the sample, namely the number of
rolls, where each roll consists of tossing N (N = 7) M&Ms. |
|
While
1 |
We
start taking samples. The only way to interrupt this process is to stop the
program by pressing ON 1 or ON ENTER. |
|
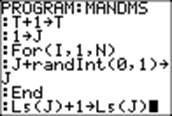
T+1→T |
Increase
the number of rolls by 1. |
|
1→J |
Store
1 in J. Variable J will hold 1 plus the number of M&Ms that have M up, in one roll of 7
M&Ms. So J takes on the values 1 through
8. |
|
For
(I,1,N) J+randInt(0,1) →J |
For
each of 7 tosses, randomly choose either 0 or 1 (to indicate whether M is
down (0) or up (1) on this toss). When M is up, then the value in J increases
by 1. You may think that each value of
variable I represents an individual M&M used in
one roll. |
|
End |
|
|
L5 (J)+1→L5 (J) |
Add
one to the Jth element of the list L5. It updates the number of
occurrences of 0s, 1s,..., and 7s
in the sample . |
|
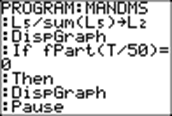
L5/sum(L5) →L2 |
L2 contains the frequencies of the outcomes
from 0 through 7 in the sample of T rolls. (L5 contains just the numbers of
outcomes in the sample.) |
|
DispGraph |
Because
we have set the window appropriately, and also set StatPlot1 on, using L1 and L2, a graph will display in the graph
window. It shows a frequency
distribution of outcomes 0 through 7 on the x-axis and the frequency of each
throw on the y-axis. |
|
If
fPart(T/50)=0 Then DispGraph Pause Disp T |
Whenever
T is divisible by 50, then the display ofgraphs is interrupted, and instead,
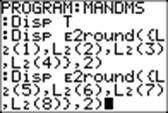
nine numbers are shown on the home screen: T (the number of tosses so far);
and the percentage of times that 0, 1, 2, 3, 4, 5, 6, and 7 M&Ms have had their M sides up, so far,
rounded to the nearest whole percent. E2 = 102 = 100, which
changes the frequencies stored in L2 to a percentage. |
|
Disp E2round({L2(1), L2(2),L2(3),L2 (4)}2) Disp E2round({L2(5), L2(6),L2(7),L2 (8)0}2)) |
|
|
Pause |
Press
ENTER to get the next fifty tosses. |
|
End |
|
|
End |
|
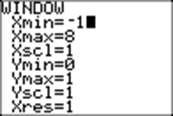
Be sure to set the set the window:
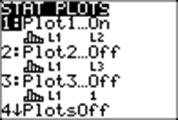
And turn on StatPlot1 with L1 for Xlist and L2 for Frequency :
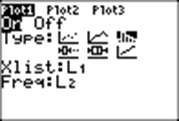
We choose type 3, a histogram,
for our graph.
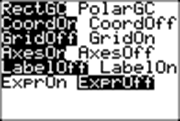
Next we set Axes On under Format:
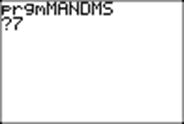
Now were ready to run the program, MANDMS.At the ? we type 7, as we are tossing 7 M&Ms during each throw:
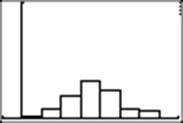
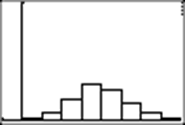
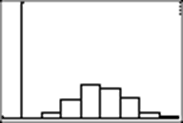
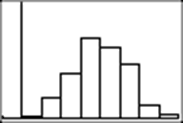
The program stops after 50 throws, and here is my first histogram. (Yours will most likely be different!)
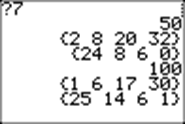
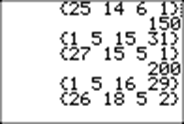
When I press ENTER, I get a screen of data:
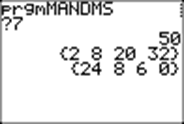
It tells me there were 50 throws of M&Ms, and the percentages of each outcome were:
0Ms up 2%
1M up 8%
2Ms up 20%
3Ms up 32%
4Ms up 24%
5Ms up 8%
6Ms up 6%
7Ms up 0%
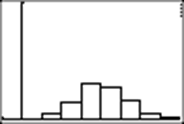
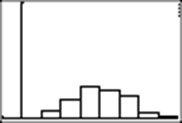
I press ENTER again, and I get another histogram and ENTER again gives more data:
Can you interpret it? (Yours will probably be different!)
I do it a few more times:
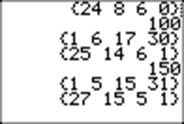
I continue as long as I want:
Ill stop at 1000 throws: (To stop the program, press ON1 or ON ENTER.)
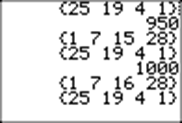
I change the window size, setting Ymax at .4, to stretch the graph vertically:
Now I use TRACE to see the values:
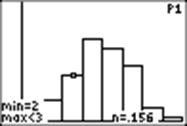
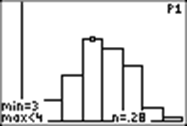
I see that 2 M&Ms up appears 15.6% of the time, and 4 come up 28% of the time (rounded).(Your findings will probably be different!)
Your task is to enter the program into your calculator and set the window, StatPlot1, and Format, and to run the program at least for 500 rolls. Now compare your percentages of different outcomes with your neighbors. Do they look rather similar?
In Part 3, we will give a theoretical interpretation of what is happening.
Return