Statistics with M&M's
This lesson has three parts. One is a hands-on activity with M&Ms. The second is a calculator simulation involving collecting a lot of simulated data based on the hands-on activity, and the third is a theoretical interpretation of what is happening.
Part 1.
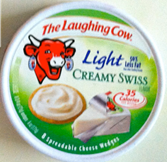
Each person needs a baggie with seven M&M’s of the same color and a tally sheet. You also need an opaque container with a lid (a Laughing Cow cheese container works well).
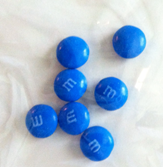
Place the seven M&M’s in the container and put the lid on. Shake the container and then open it and count how many M&M’s have the “M” side up. This number will be between 0 and 7.
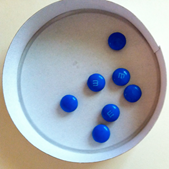
Record the number on the tally sheet.(Above, the number is 3.)
Repeat this as long as you want, but at least 20 times, and then prepare a histogram. On the x-axis should be the numbers 0 through 7, labeled "Number of candies with the "M" side up". On the y-axis the numbers should be 0, 1, 2, 3, and it should be labeled frequency.
Look at the histograms that others in the class have made. Most likely they are all rather different. But this is not the final conclusion. In Part 2 we will see what happens when we have very large samples. Do the histograms remain different? Or do they begin to become more similar? (I hope they will become more similar!)
Return