
Calculator: TI-83.
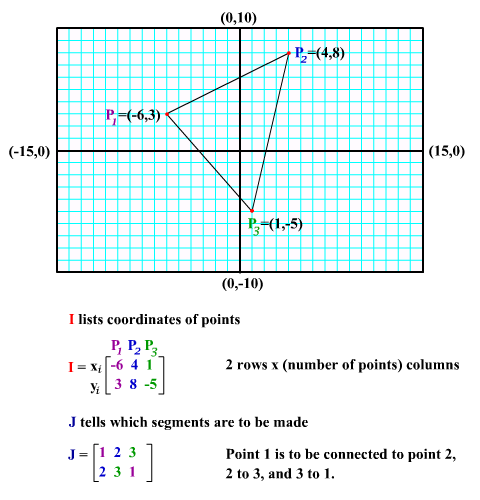
Data structures.
We are going to keep all our points in one table (matrix), [I], and all our segments in a second table [J].[[x1 x2 x3 x4 x5]
[y1 y2 y3 y4 y5]]
[[1 1 2 4]
[2 3 4 5]]
Task 1.
Choose the coordinates of 5 points and create matrices [I] and [J].
| Drawing program. | Explanation |
| PROGRAM:DRAW |
|
| :dim([J])→L1 | Get the dimension of table J of pairs of points to be connected.This dimension consists of 2 numbers, e.g., {2,4} is 2 rows and 4 columns. This 2 means 2 points will be connected at one time, and 4 means we have 4 pairs of points, so we will make 4 segments. We will connect 2 points at one time.L1(2) is the number of segments (the number of pairs of points to be connected). |
| :For(K,1,L1(2)) | Each point has a number, 1, 2, 3, 4, & 5; and their coordinates are in matrix I. |
| :[J](1,K)→P | Points numbered P and Q are end-points of the Kth segment. |
| :[J](2,K)→Q | They need to be connected at this time. |
| :Line([I](1,P),[I](2,P),[I](1,Q),[I](2,Q)):End | Segment P Q is drawn. In order to draw the segment, we have togive 2 coordinates of the 1st point, x and y, and 2 coordinates of the 2nd point, x and y. [I](1,P) gives the 1st coord. of point P [I](2,P) gives the 2nd coord. of point P. [I](1,Q) gives the 1st coord. of point Q. [I](2,Q) gives the 2nd coord. of point Q. So the segment between the two points P and Q is drawn. End of for loop |
Task 2.
Execute DRAW.
Remark.
To erase the picture from the screen, use ClrDraw. Just to return to the home screen (without erasing the drawing), press CLEAR.
Task 3.
Set MODE to Degree. In matrix [A] store:
[[cos(45) sin(45)]
[-sin(45) cos(45)]] Values, not expressions, are stored.
Enter on the home screen:
[A][I]→[I]
and then repeat,
PrgmDRAW
ENTER
CLEAR
[A][I]→[I]
What do you see?
Lesson Index